RiskScape
A powerful and easy-to-use web-based data visualization tool that allows users to map diseases or health conditions, explore affected populations, and assess for changes in health conditions over time.
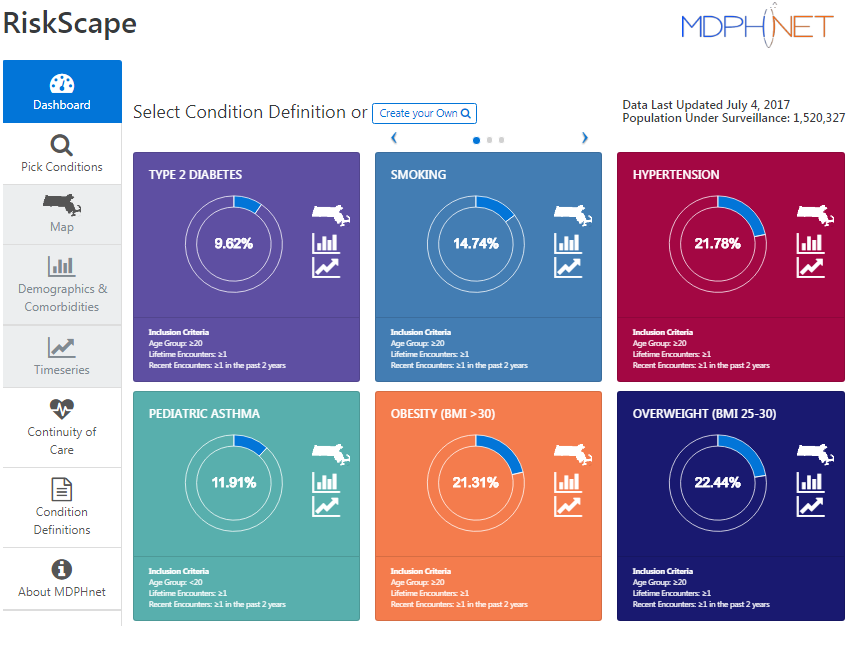
RiskScape is ESP's interactive, web-based data visualization platform. It provides timely, high-level summaries of specific conditions of interest to public health officials.It utilizes data from the same clinical partners as MDPHnet but is built on a centralized, individual-level, deidentified dataset that is updated monthly.
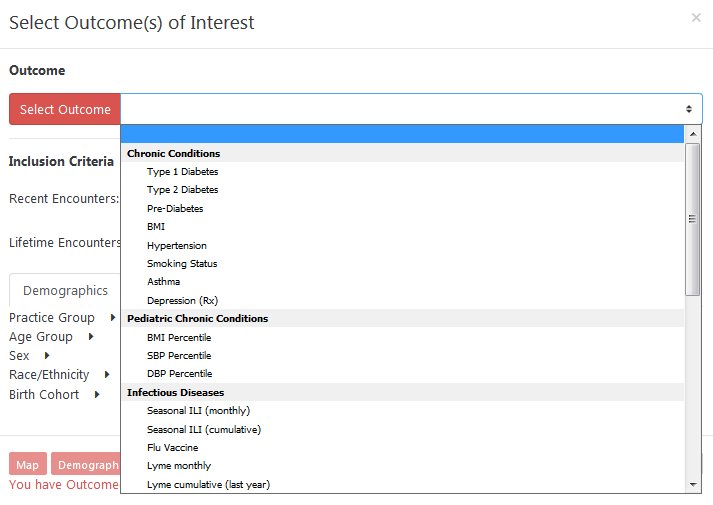
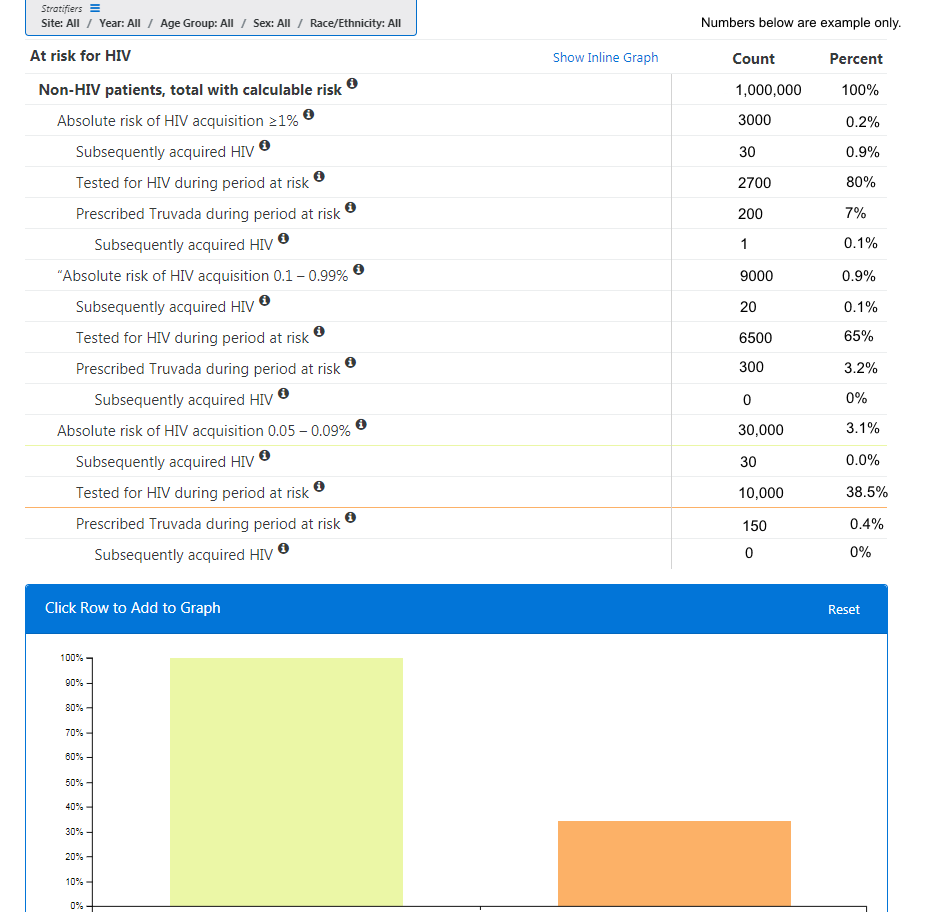
Users can generate graphs based on condition of interest while filtering or stratifying by other factors such as age, sex, race/ethnicity, health indicators, and comorbidities.
RiskScape Image Gallery
Available graphs include
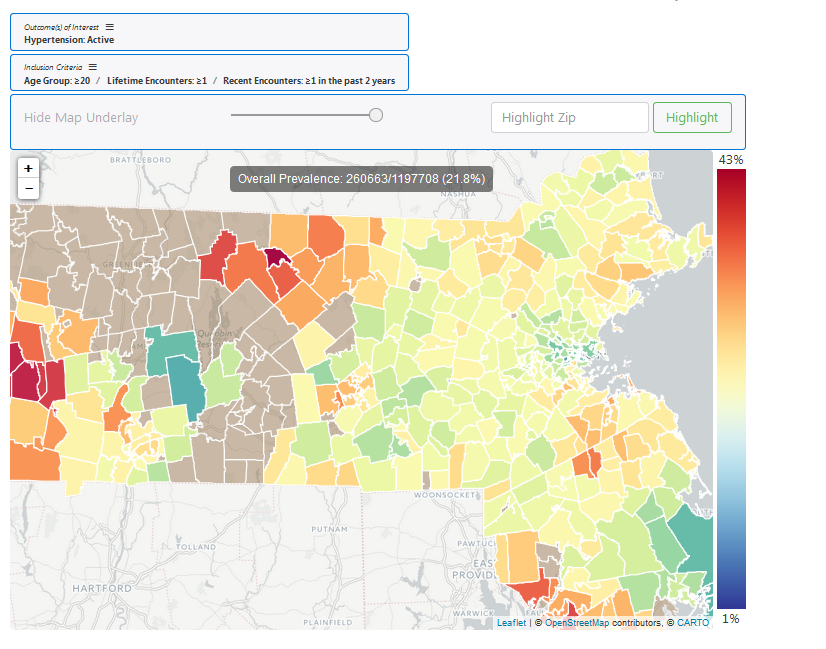
- Heat maps of conditions by zip code
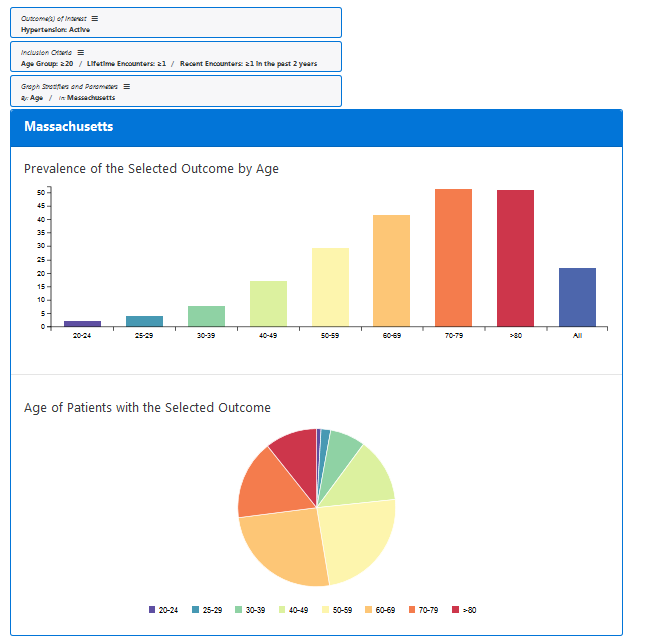
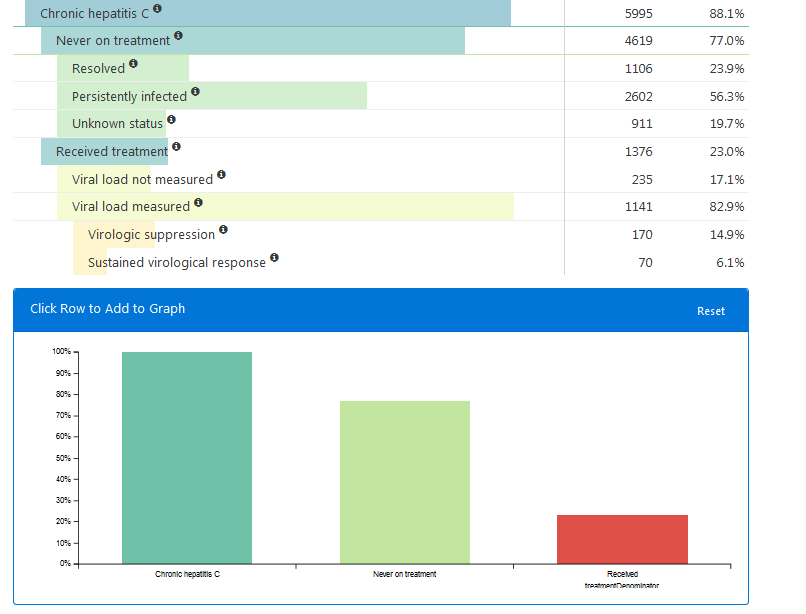
- Bar graphs for prevalences stratified by demographic or comorbidity categories
- Pie charts with demographic characteristics of affected populations
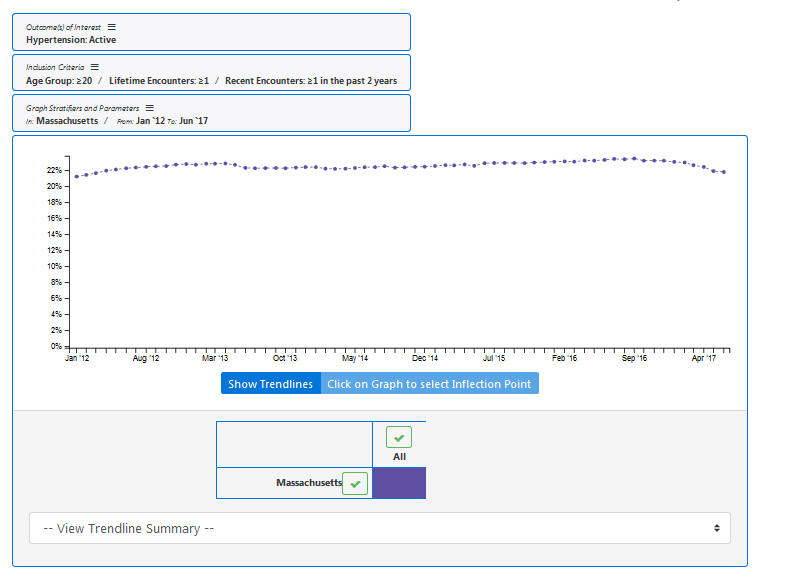
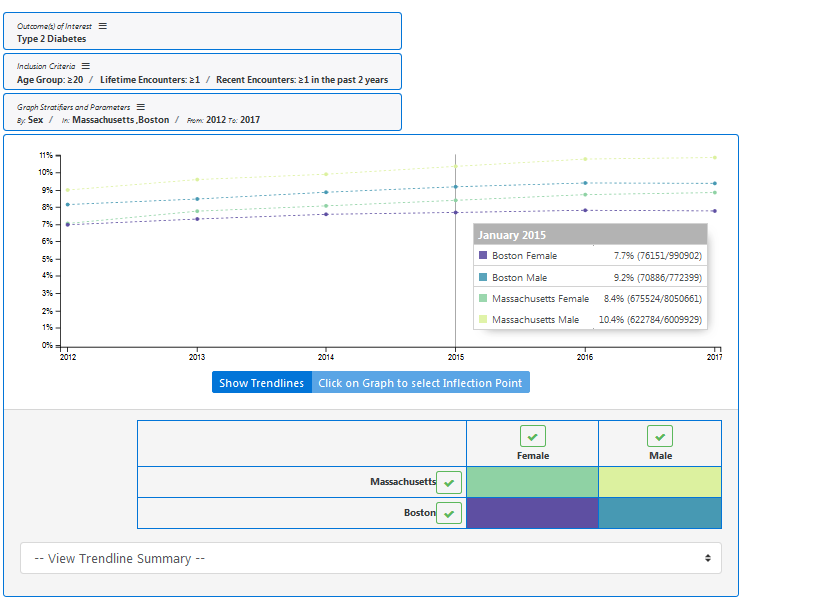
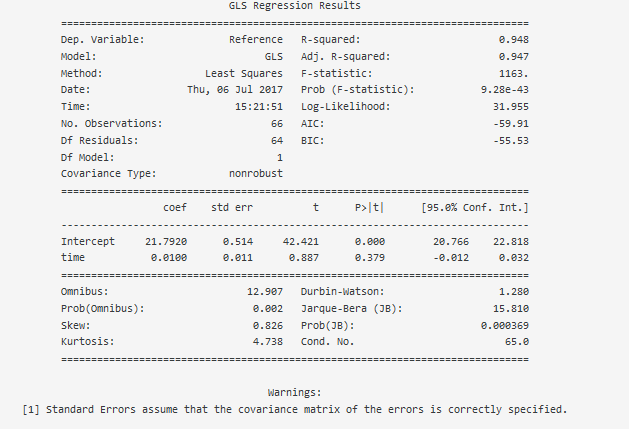
- Time series graphs that permit automated regression analyses
Conditions available for query in RiskScape include
Conditions
- Asthma
- Depression
- Hypertension* and diagnosed hypertension
- Body mass index*
- Pre-diabetes
- Diabetes, Type 1
- Diabetes, Type 2
- Diabetes, Gestational
- Pregnancy status
* with percentiles for pediatric groups
Infectious Diseases
- Chlamydia
- Gonorrhea
- Influenza-like Illness
- Lyme Disease
- Pertussis
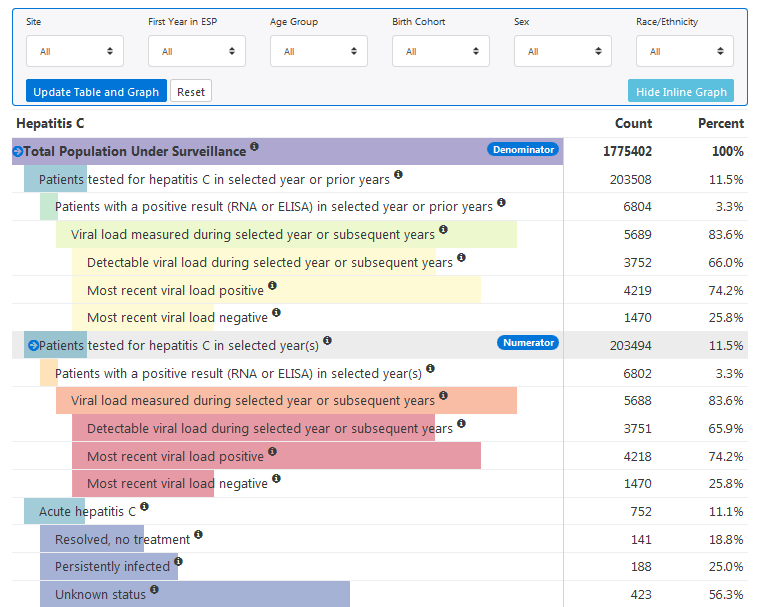
- Hepatitis C screening
Controlled Substances
- Opioid prescribing
- High dose opioid prescribing
- Benzodiazepine prescribing
- Concurrent prescriptions for opioids and benzodiazepines
Labs & Meds
- Hemoglobin A1C levels
- LDL cholesterol levels
- Triglyceride levels
- Influenza vaccinations
- Insulin prescribing
- Metformin prescribing
Access to RiskScape is limited to practice sites that contribute data to RiskScape and selected employees of the Massachusetts Department of Public Health.
The analog to RiskScape for reportable conditions is called Massachusetts Platform for Analyzing and Graphing Infections, or MAGIC. MAGIC provides timely, high-level summaries and analyses of specific health measures of interest to public health practitioners and others charged with population health management within MDPH's Bureau of Infectious Disease and Laboratory Sciences (BIDLS) and participating clinical sites. About ESP and Massachusetts Platform for Analyzing and Graphing Infections (MAGIC) | Mass.gov